
Raster and vector charts are two types of electronic navigational charts (ENCs) that are commonly used by mariners for navigation purposes. While both types of charts serve the same purpose of providing a visual representation of the sea area and its surroundings, they differ in terms of their characteristics, data handling, and application.
- Raster and Vector Charts Used Onboard Ships
- Differences between raster and vector charts
- Frequently Asked Questions (FAQs)
- Conclusion
- Raster and Vector Charts: Comprehensive Guide to Understanding the Difference
- 1. Raster and Vector charts: Explained
- Use Cases for Raster and Vector charts
- 3. Pros and Cons of Raster and Vector charts
- Vector charts: Pros and Cons
- Frequently Asked Questions (FAQs)
When it comes to maritime navigation, accurate and up-to-date charts are of paramount importance. Ships rely on charts to navigate the vast oceans, avoiding obstacles and safely reaching their destinations. In recent years, raster and vector charts have become integral tools used onboard ships to enhance navigation efficiency and safety. In this article, we will delve into the world of raster and vector charts, explore their differences, advantages, and applications, and shed light on how they are utilized onboard ships. So, grab your compass and join us on this voyage of discovery!
Raster and Vector Charts Used Onboard Ships
Onboard ships, both raster and vector charts play crucial roles in providing navigational information to the crew. These charts serve as visual aids, representing waterways, coastlines, depths, and other essential features of the marine environment.
They are used in combination with other navigation tools such as GPS and electronic chart display and information systems (ECDIS) to ensure accurate and safe navigation. Let’s dive deeper into the characteristics and applications of raster and vector charts.
Raster Charts: A Visual Perspective

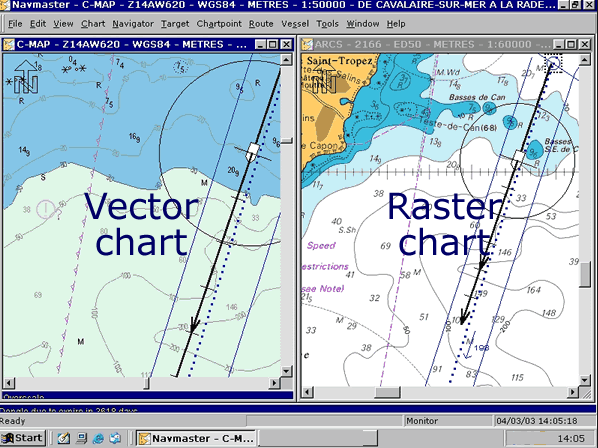
Raster charts, also known as electronic raster charts (ERCs), are digital representations of paper charts. They are created by scanning paper charts and converting them into digital images. Raster charts provide a visual representation of the navigational area and its features. They are particularly useful for displaying familiar chart symbols and other visual details that mariners are accustomed to from traditional paper charts. Raster charts are often used as a backup to electronic charts and are compatible with various ECDIS systems.
Raster charts are digital versions of paper charts, and they are essentially scanned images of the paper charts. They consist of pixels that represent the various features and characteristics of the sea area, such as landmasses, depth contours, navigation aids, and hazards.
Raster charts are easy to use and are widely available, making them a popular choice for small vessels and recreational boaters.
However, they have limited functionality and can only provide basic navigation information. Additionally, because they are essentially scanned images, they can become distorted and lose their accuracy if they are enlarged or zoomed in too much.
Some notable features of raster charts include:
- Pixel-based images: Raster charts are composed of a grid of pixels, similar to photographs. Each pixel represents a specific color value, contributing to the overall image.
- Georeferencing: To ensure accurate positioning, raster charts are georeferenced, which means they are aligned with geographical coordinates. This allows the charts to be overlaid on electronic systems accurately.
- Chart updates: Unlike vector charts, which can be updated dynamically, raster charts require manual updates. New editions must be scanned and processed to create updated versions of the charts.
Despite their limitations, raster charts offer several advantages. They are widely available and familiar to mariners who have used traditional paper charts. Moreover, they provide a quick visual reference and can be easily understood, making them valuable during emergencies or system failures.
Also Read – The sunsetting of raster charts – The dawning of new vector charts
Vector Charts: A Digital Approach
In contrast to raster charts, vector charts are constructed using mathematical formulas to represent geographic features. Instead of relying on pixel-based images, vector charts store data as a collection of points, lines, and polygons, allowing for dynamic rendering and interaction. Vector charts are increasingly preferred onboard ships due to their versatility and ease of use. Let’s explore their key characteristics.
On the other hand, vector charts are made up of vector data, which is essentially a set of mathematical coordinates that define the location and characteristics of features on the chart. Vector charts are highly detailed and can display a vast array of information, including water depths, coastlines, buoys, lighthouses, and other navigational aids.
They can also provide additional features, such as tide and current information, and can be updated easily to reflect changes to the sea area. Furthermore, because vector charts are made up of mathematical coordinates, they can be easily zoomed in or out without losing their accuracy or resolution.
Scalability: Vector charts are resolution-independent, meaning they can be scaled without losing detail. This scalability allows mariners to zoom in or out, focusing on specific areas of interest while maintaining clarity.
- Dynamic updates: Vector charts can be updated dynamically, ensuring that mariners have access to the most recent navigational information. This feature is particularly crucial in areas prone to rapid environmental changes, such as shifting sandbars or newly discovered wrecks.
- Data layers: Vector charts can display multiple layers of information, providing a comprehensive view of the marine environment. Layers can include depth contours, buoys, traffic separation schemes, and even meteorological data.
The flexibility and interactivity of vector charts make them invaluable tools for modern navigation. Mariners can customize the display to suit their specific needs, toggle on or off different data layers, and receive real-time updates
The flexibility and interactivity of vector charts make them invaluable tools for modern navigation. Mariners can customize the display to suit their specific needs, toggle on or off different data layers, and receive real-time updates. These updates can be obtained through various means, such as satellite or internet connectivity, ensuring that mariners have the most accurate and up-to-date information at their fingertips.
In addition to their dynamic nature, vector charts offer other advantages:
- Efficient data storage: Vector charts require less storage space compared to raster charts. This makes them ideal for devices with limited memory, such as portable navigation systems or onboard computers.
- Effortless chart updates: Since vector charts are data-based, updates can be easily incorporated without the need for manual scanning and processing. New data can be seamlessly integrated into the existing chart, providing mariners with the latest navigational information.
- Chart customization: Vector charts allow mariners to customize the information displayed according to their preferences. They can choose which data layers to display, adjust colors and symbols, and highlight specific areas of interest. This flexibility enhances situational awareness and aids decision-making during navigation.
As technology advances, the maritime industry is increasingly transitioning towards the use of vector charts for navigation. However, it is worth noting that raster charts still hold significance, especially as a backup system or for areas where vector data might be limited or unavailable. Mariners often rely on a combination of both raster and vector charts to ensure redundancy and enhance safety at sea.
In conclusion, while raster and vector charts both serve the same purpose of providing a visual representation of the sea area and its surroundings, they differ in their characteristics, data handling, and application. Raster charts are simple to use and widely available, while vector charts are highly detailed and can be updated easily to reflect changes to the sea area. Ultimately, the choice of which type of chart to use will depend on the user’s specific needs and requirements.
Differences between raster and vector charts
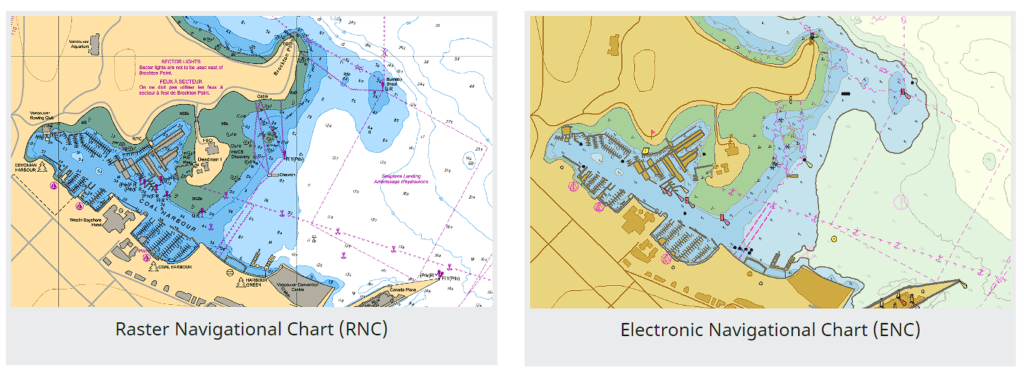
RNCs are simply an electronic image of a paper chart. They are digitized by scanning the paper chart and converting each line to a raster picture element or “pixel”. Beyond geo-referencing (positioning the scanned chart so that it appears in the right location with correct x and y coordinates), there is no intelligence or extra data in the raster image.
ENCs are “smart charts”, which means the user can click on different features, such as a light or buoy, to retrieve additional information not available in paper or raster charts. For example, a wharf appears only as an image on an RNC, but an ENC can identify it as a wharf and attach attributes to it such as height, length, age, ownership, number of berths, etc. This additional data, which is contained directly within the ENC, might otherwise only be available by consulting the relevant Sailing Directions publication.
ENCs used on an Electronic Chart Display and Information System (ECDIS) and integrated with other data such as GPS position, radar, planned routes, heading, speed, and draught, assist mariners and alert them to sailing hazards, warnings, and dangerous situations. ENCs are powerful and flexible navigational tools that provide users with more control over the display of the chart.
One of the main differences between raster and vector charts is the way they handle data. Raster charts are essentially images, and as such, they are static and cannot be updated or edited easily. Vector charts, on the other hand, are dynamic and can be updated easily to reflect changes to the sea area.
Additionally, vector charts can be customized to display only the information that is relevant to the user, while raster charts provide a fixed set of information that cannot be altered.
Raster Charts:
- Raster charts are digital representations of paper charts.
- They are created by scanning paper charts and converting them into digital images.
- Raster charts are composed of a grid of pixels, similar to photographs.
- Each pixel represents a specific color value, contributing to the overall image.
- Raster charts are georeferenced, meaning they are aligned with geographical coordinates.
- They provide a visual representation of the navigational area and its features.
- Raster charts are often used as a backup to electronic charts and are compatible with various ECDIS systems.
- They require manual updates, as new editions must be scanned and processed to create updated versions of the charts.
- Raster charts are widely available and familiar to mariners who have used traditional paper charts.
- They offer a quick visual reference and can be easily understood, making them valuable during emergencies or system failures.
Vector Charts:
- Vector charts are constructed using mathematical formulas to represent geographic features.
- They store data as a collection of points, lines, and polygons, allowing for dynamic rendering and interaction.
- Vector charts are resolution-independent, meaning they can be scaled without losing detail.
- They can be updated dynamically, ensuring that mariners have access to the most recent navigational information.
- Vector charts can display multiple layers of information, providing a comprehensive view of the marine environment.
- They offer scalability, allowing mariners to zoom in or out, focusing on specific areas of interest while maintaining clarity.
- Vector charts can be customized to suit specific needs, such as toggling different data layers or adjusting colors and symbols.
- They require less storage space compared to raster charts, making them suitable for devices with limited memory.
- Updates to vector charts can be easily incorporated without the need for manual scanning and processing.
- They are increasingly preferred for navigation due to their versatility, ease of use, and real-time updates.
These differences highlight the unique characteristics and advantages of both raster and vector charts. Mariners often utilize a combination of these chart types to ensure comprehensive and accurate navigational information onboard ships.
Another difference between the two types of charts is their application. Raster charts are typically used for simple navigation purposes and are popular among small vessels and recreational boaters. Vector charts, on the other hand, are more advanced and are often used by commercial vessels, such as cargo ships and tankers, that require highly accurate and detailed information to navigate safely.
In addition, vector charts are often used in conjunction with electronic chart display and information systems (ECDIS), which provide advanced features such as route planning, real-time tracking, and collision avoidance.
Raster and Vector Charts – Advantages and Disadvantages – Watch Youtube Video
Frequently Asked Questions (FAQs)
- Are raster charts still relevant in the era of vector charts?Absolutely! Raster charts continue to serve an essential role in maritime navigation. They offer a familiar visual representation and serve as a reliable backup in case of system failures. Mariners often use raster charts in conjunction with vector charts to ensure comprehensive navigational information.
- Can vector charts be used offline?Yes, vector charts can be used offline. Mariners can pre-load vector charts onto their navigation systems or devices before heading out to sea. Once downloaded, the vector charts can be accessed and utilized without an internet or satellite connection.
- Do vector charts require specialized software or equipment?Vector charts can be used with various software applications and navigation systems. However, compatibility may vary depending on the specific software and device. It is essential to ensure that the chosen software or device supports the use of vector charts before relying on them for navigation.
- Are vector charts available for all regions worldwide?Vector charts are becoming increasingly available for many regions worldwide. However, the availability and coverage may vary depending on the specific area and the organization responsible for chart production. It is advisable to consult official sources or reputable chart providers to determine the availability of vector charts for a particular region.
- Can vector charts be used on different types of vessels, such as recreational boats or commercial ships?Yes, vector charts can be used on various types of vessels, including recreational boats, commercial ships, and even smaller watercraft. The versatility and scalability of vector charts make them suitable for a wide range of maritime applications.
- How often are vector charts updated?The frequency of vector chart updates depends on various factors, including the organization responsible for chart production and the specific area covered by the chart. In general, efforts are made to update vector charts regularly to reflect any changes in navigational features, hazards, or other relevant information.
Conclusion
In conclusion, raster and vector charts are indispensable tools used onboard ships for safe and efficient navigation. Raster charts provide a visual representation that mariners are familiar with, while vector charts offer scalability, dynamic updates, and customizable display options.
Raster and Vector Charts: Comprehensive Guide to Understanding the Difference
In the world of digital graphics and design, two primary types of charts dominate the scene: Raster charts and Vector charts. These chart formats serve as the foundation for creating visually appealing and informative visuals, whether it’s for websites, presentations, or print media. Understanding the differences between raster and vector charts is essential to make informed decisions about which format to use in different scenarios. This comprehensive guide will delve into the intricacies of raster and vector charts, providing you with the knowledge needed to choose the most suitable option for your specific graphic design needs.
1. Raster and Vector charts: Explained
1.1 What are Raster charts?
Raster charts, also known as bitmap charts, are composed of a grid of pixels that collectively form an image. Each pixel contains specific color and shading information, creating a visually coherent picture when viewed at a distance. Raster charts are resolution-dependent, meaning they have a fixed number of pixels and can lose quality when scaled up or zoomed in. Common file formats for raster charts include JPEG, PNG, and GIF.
1.2 What are Vector charts?
Vector charts, on the other hand, are comprised of mathematical equations and coordinates rather than individual pixels. This format uses lines, curves, and shapes to define images, making them infinitely scalable without losing any quality. Vector charts are resolution-independent and offer exceptional flexibility for various design purposes. Common file formats for vector charts include SVG, AI, and EPS.
The fundamental difference between Raster and Vector charts
The main difference between raster and vector charts lies in their underlying composition. Raster charts are pixel-based, while vector charts rely on mathematical formulas to define graphics. This distinction gives each format its unique characteristics and applications.
Use Cases for Raster and Vector charts
Raster charts: When to use them?
Raster charts are suitable for scenarios that prioritize photographic realism and detailed imagery. Here are some common use cases where raster charts excel:
- Photography and Image Editing: Raster charts are perfect for editing and enhancing photographs, as they capture fine details and color nuances effectively.
- Web Design: When it comes to designing websites, raster charts are useful for creating visually stunning backgrounds, banners, and image galleries.
- Print Media: Raster charts are widely used in print media, such as magazines and brochures, as they accurately represent intricate designs and high-resolution images.
Vector charts: When to use them?
Vector charts offer several advantages in specific scenarios, making them ideal for the following use cases:
- Logo Design: Vector charts are highly recommended for designing logos since they can be scaled up or down without any loss of quality, ensuring crisp and sharp visuals in any size.
- Typography and Text-based Graphics: When creating typographic designs or textual elements, vector charts are preferred as they maintain clarity and sharpness, regardless of the size or resolution.
- Illustrations and Infographics: Vector charts are perfect for creating illustrations and infographics that require precise shapes, curves, and scalability.
3. Pros and Cons of Raster and Vector charts
Raster charts: Pros and Cons
Pros:
- Raster charts excel in representing complex, detailed images and photographs.
- They are widely supported across various software applications and web browsers.
- Raster charts are easy to edit and modify using photo editing software.
- They can achieve highly realistic visual effects and textures.
Cons:
- Raster charts are resolution-dependent and can lose quality when scaled up or zoomed in.
- Enlarging raster charts beyond their original resolution can result in pixelation and loss of clarity.
- Raster charts tend to have larger file sizes compared to vector charts.
- They are not suitable for creating graphics that require scalability or precise editing of individual elements.
Vector charts: Pros and Cons
Pros:
- Vector charts can be scaled infinitely without any loss of quality or detail.
- They offer precise control over individual elements, making them ideal for editing and manipulating shapes, lines, and curves.
- Vector charts have smaller file sizes compared to raster charts, making them more efficient for storage and transfer.
- They are well-suited for creating graphics that require scalability, such as logos and icons.
Cons:
- Vector charts are not suitable for representing complex, detailed images or photographs.
- Achieving realistic visual effects and textures can be challenging with vector graphics.
- Certain software applications and web browsers may have limited support for vector formats.
Frequently Asked Questions (FAQs)
4.1 Are raster charts better than vector charts?
No, it depends on the specific requirements of your project. Raster charts excel in representing detailed images and photographs, while vector charts offer scalability and precise editing capabilities. Assess your project needs and choose the format accordingly.
4.2 Can I convert a raster chart into a vector chart?
While it is possible to convert a raster chart into a vector chart using specialized software, the process is not always perfect. Converting raster to vector can result in loss of detail and require manual adjustments to achieve desired results.
4.3 Which file format is best for sharing raster charts?
For sharing raster charts, commonly used file formats include JPEG for photographs, PNG for images with transparency, and GIF for animated images. Choose the format that best suits your specific needs.
4.4 Are vector charts compatible with all software applications?
Vector charts are compatible with most graphic design software applications, including Adobe Illustrator and CorelDRAW. However, it’s essential to ensure that the software you’re using supports vector formats such as SVG, AI, or EPS.
4.5 Can I use both raster and vector charts in the same design project?
Yes, it is common to combine raster and vector charts within a design project. For example, you can use raster charts for detailed images and photographs, while incorporating vector charts for scalable logos or text-based elements.
4.6 Are there any online resources to learn more about raster and vector charts?
Yes, there are numerous online resources available to learn more about raster and vector charts. Websites like Wikipedia provide comprehensive information on these topics, offering valuable insights into their applications and technical aspects.
Conclusion
Raster and vector charts are two fundamental formats in graphic design, each with its unique advantages and best use cases. Raster charts excel in representing detailed images and photographs, while vector charts offer scalability and precise editing capabilities. Understanding the differences between these formats is crucial for selecting the most suitable option for your specific design needs. By making informed choices, you can create visually appealing graphics that meet your desired outcomes.